Solved

Gantt Charts, Milestones, Dynamic Forecasting

  • September 2, 2026
  • 3 replies
  • 55 views

mhellweg
Forum|alt.badge.img+16

Hello! Who is using Gantt Charts, MIlestones, or Dynamic Forecasting and loves it? I’d love to know how you’re using it and what insight it’s providing. Thank you in advance!

Best answer by Amy_Groves

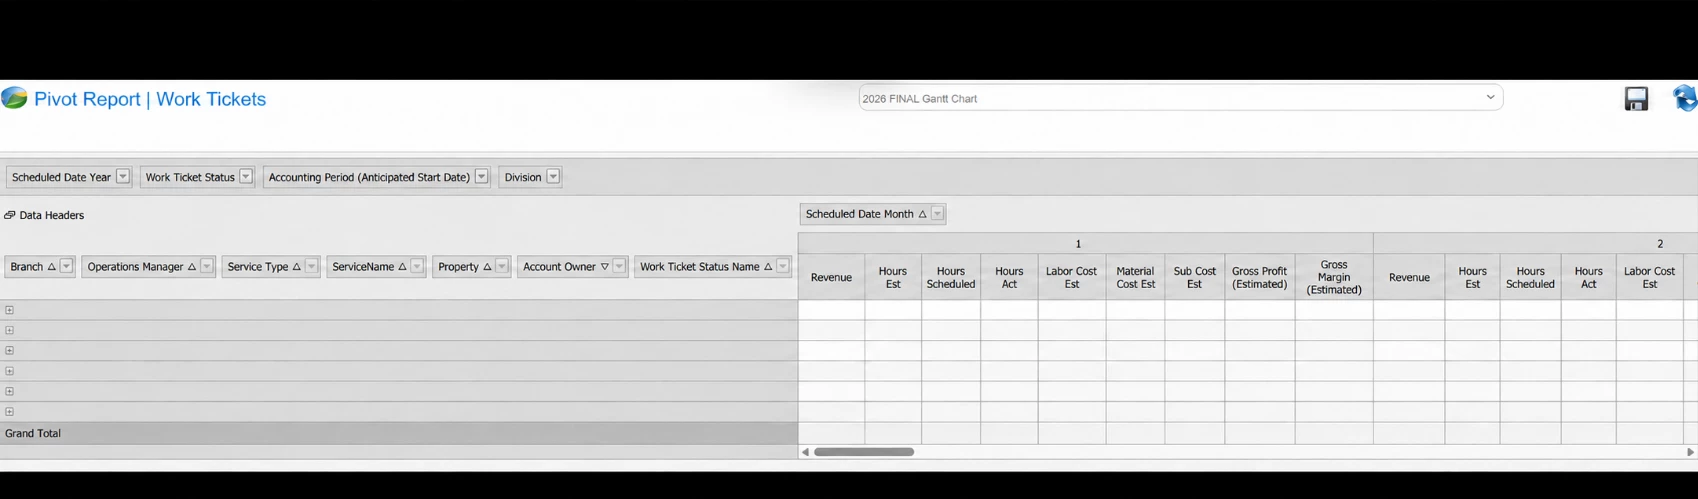
I use the Gantt Charts in the Pivot Table to show me the entire year.  Forecasting Maintenance is easy even if the contracts haven’t renewed, Aspire will assume they do by pulling last years actuals.  Forecasting for Enhancements / Construction is difficult that spread over months.

View original

3 replies

Amy_Groves
Forum|alt.badge.img+18
  • Inspiring
  • Answer
  • September 2, 2026

I use the Gantt Charts in the Pivot Table to show me the entire year.  Forecasting Maintenance is easy even if the contracts haven’t renewed, Aspire will assume they do by pulling last years actuals.  Forecasting for Enhancements / Construction is difficult that spread over months.


mhellweg
Forum|alt.badge.img+16
  • Author
  • Inspiring
  • September 2, 2026

​@Amy_Groves thanks! where do I find the Pivot Table that shows gantt charts? I’m not familiar with that. Thank you!


Amy_Groves
Forum|alt.badge.img+18

Go to Standard Reports / Production / Work Tickets Pivot Report - build the Gantt Chart with the fields below.  

Schedule Date Year - 2026

Work Ticket Status - All should be checked except Canceled

Account Period - Do Not Change - when you select the Scheduled Date Year, these this will auto populate.  

You can see 1 at the top of Labor Cost Est - represents Jan, Feb and so on, the total will be at the far right.

Hope this helps!